At national and subnational levels, scorecard management tools help drive improvements in data reporting timeliness and completeness. Most countries (including Burundi, Ghana, Kenya, Liberia, Malawi, Mali, Nigeria, Senegal, Sierra Leone and Zambia) have integrated reporting ‘completeness’ and ‘timeliness’ into their scorecards.
What data completeness and timeliness mean and why they matter
Data completeness
Data completeness indicators track the percentage of expected reports actually submitted. For example, if 7 out of 10 health facilities in a district submitted their reports, then that district’s ‘completeness’ indicator would be 70%.
Data completeness also plays an important role in interpreting other scorecard indicators by providing insight into how reliable the data are in reflecting the true situation on the ground. For example, if the indicator for antenatal care visits during the first trimester (known as ANC1) is at 5%, but only 20% of health facilities are submitting reports, you cannot make confident conclusions on the real performance of that indicator.
Data timeliness
Timeliness refers to the percentage of reports that were submitted on time. It is important that reports are submitted on time so that evidence-based decisions can be made promptly as problems arise.
Reporting rates
Most countries have relatively strong completeness reporting rates in the high 90’s (%). Timeliness shows more variation and tends to be lower than completeness. The data generally shows a steady improvement in completeness and timeliness across countries over the long-term. However, there are periodic fluctuations in reporting rates when countries change to new reporting tools and when health information officers – who are responsible for inputting data – are on strike.
Completeness and timeliness indicators help countries track and improve data reporting practices
Completeness and timeliness scorecard indicators help countries to closely track reporting practices and allows for follow up with regions, districts and facilities that are failing to submit their data according to national reporting protocol. Across the continent, scorecards are used by countries during data audits and data validation meetings to identify the locations that have issues with reporting.
In addition to the completeness and timeliness indicators, scorecards boldly show blank indicator cells in white where the data hasn’t been reported. Some countries also assign a red colour to cells that show outliers going above 100%. This allows for an even more focused follow up on specific indicators not being reported and targeted re-training with the right cadres of health staff responsible for particular data sets.
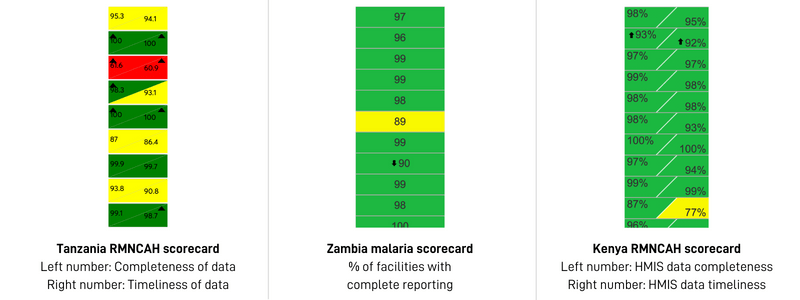
Examples from country scorecards
Through the completeness and timeliness indicators and by highlighting blank cells, scorecards are actively used to identify reporting issues and facilitate feedback to create corrective measures that improve data. Systematic scorecard assessments of data gaps have helped countries to improve reporting rates and timeliness. In some countries, these gaps have even led the country to adopt widespread measures to address reporting issues.
Zambia – improving the data entry process
In Zambia in quarter 2 (April to June) 2021, for example, an analysis of the scorecard conducted by the Luapula Provincial Health Management Team revealed that the low performance (56%) of the indicator ‘long-lasting insecticidal nets (LLINs) distributed to pregnant women through ANC’ had a historically low trend. After further investigation, they discovered that the issue was actually a problem in data entry. A follow up was made with all facilities to improve the data entry process and to correct the discrepancies. With more complete data, indicator performance for ‘long-lasting insecticidal nets (LLINs) distributed to pregnant women through ANC’ increased to 80% in quarter 3 (July to September) 2021.
Malawi – strengthening data accuracy and completeness to improve DHIS2 under-reporting
To strengthen data accuracy and completeness in Malawi, resources were mobilised to start the process of linking different digital data sources with DHIS2 so that under-reporting in DHIS2 could improve. Approximately US$25,000 was mobilised to train HMIS officers in other digital platforms to ensure they could capture the data in DHIS2. In quarter 4 (October to December) 2016, data completeness was at 68%, while in quarter 2 (April to June) 2022 the completeness had increased to 92%. Timeliness has also drastically improved, from 47% in quarter 1 (January to March) 2014 to 84% in quarter 2 (April to June) 2022 following the training.
Sierra Leone – securing funds for short term data entry staff to improve completeness
In Sierra Leone, data completeness was dropping significantly at both primary health units and hospitals. The Maternal and Child Health (MCH) Directorate, advocated with the Minister of Health, who supported them in securing funds to give short term contracts to hospitals and District Health Management Team (DHMT) staff for entering data. The Ministry of Health also decided to separate data completeness indicators for hospitals and primary health units for closer tracking. In quarter 4 (October to December) 2020, data completeness was 94%, while a year later in quarter 4 (October to December) 2021, data completeness improved to 97%.
Liberia – using the scorecard in routine M&E technical working groups
In Liberia, where the scorecard is used in routine monitoring and evaluation technical working groups, the scorecard has seen great improvements in data completeness and timeliness.
In quarter 4 (October to December) 2013, data completeness was 83%. By quarter 1 (January to March) 2022, data completeness had improved to 95%. Timeliness also increased from 36% in quarter 4 (October to December) 2013 to 82% in quarter 3 (July to September) 2019 and then to 95% in quarter 1 (January to March) 2022.
Kenya – using the scorecard in routine data audits leads to completeness and timeliness improvements
In Kenya, where the scorecard is also used for routine data audits, the scorecard has shown improvements in reporting. Data completeness improved from 90% in quarter 4 (October to December) 2013 to 98% in quarter 4 (October to December) 2021. Data timeliness also improved from 74% in quarter 4 (October to December) 2013 to 95% in quarter 4 (October to December) 2021.
Tanzania – using the scorecard for regular data checks leads to completeness and timeliness improvements
In Tanzania, where the scorecard is similarly used in regular data checks, completeness improved from 73% in quarter 4 (October to December) 2013 to 95% in quarter 4 (October to December) 2021. Data timeliness also improved from 30% in quarter 4 (October to December) 2013 to 94% in quarter 3 (July to September) 2021.
Conclusion
Though it is difficult to attribute exactly how much scorecards have contributed to these improvements, interviews with scorecard users and online surveys suggest scorecards are widely used and favoured as one of the best tools for checking data quality, completeness and timeliness. The colours and easy-to-read format make it easy to identify outliers and blanks.
Recommendations for your scorecards
- Include indicators related to data completeness and timeliness in your scorecards to better identify and address gaps in data input procedures.
- Use completeness and timeliness indicators to assess the reliability of other indicator data.
- Systematically use scorecards in data audits to take stock of issues related to data quality, completeness, and timeliness, then send feedback regularly to those in charge of data input.
- Assign a red threshold to data outliers to easily identify aberrant data.
Share your scorecard with a broad set of stakeholders to bring visibility to data issues and incentivise correct data input at the source.