Background
The RBM Partnership to End Malaria is the global platform for coordinated action against malaria. The partnership is comprised of over 500 partners including malaria-endemic countries, bilateral and multilateral development partners, private sector, non-governmental and community-based organisations, foundations, research and academic institutions. It works to mobilise action and resources and forge consensus amongst partners. As part of its efforts to enhance data sharing and use for action, the RBM Partnership launched a Global Malaria Dashboard, in 2020, to aggregate available data to improve sharing and interoperability and trigger timely action to progress and challenges. The Global Malaria Dashboard aims to pool available data across a wide range of sources to guide policy and management decisions, as well as partner coordination to deliver targeted support to overcome bottlenecks.
How it works
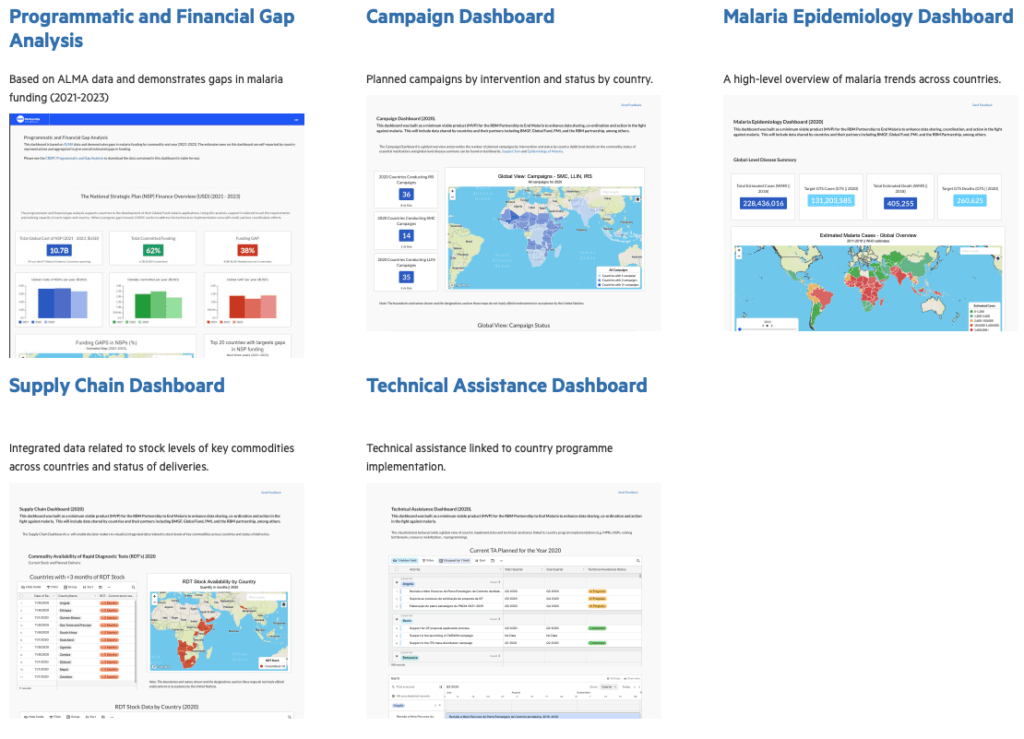
The Global Malaria Dashboard consists of 5 dashboards:
- The Programmatic and Financial Gap Analysis Dashboard: This dashboard, uses country data to demonstrate gaps in malaria funding by commodity and by year (2021 to 2023). The Dashboard uses data reported by countries and compiled by the Country Regional Support Partner Committee which is also used in the development of country Global Fund malaria applications. The RBM Country/Regional Support Partner Committee (CRSPC) works to support countries to fill key gaps through resource mobilisation efforts.
- The Campaign Dashboard: The Campaign Dashboard is a global overview that provides the number of planned campaigns by intervention (SMC, IRS, LLIN) and status (on track, at risk, off track, complete) by country. The dashboard is populated with data compiled by the CRSPC. The CRSPC supports countries that are off track, including for LLIN campaigns through the Alliance for Malaria Prevention (AMP).
- The Malaria Epidemiology Dashboard: The Malaria Epidemiology dashboard uses data from the WHO World Malaria Report to show a visualisation of the impact and burden of malaria around the world. This includes maps and graphs showing incidence by country, number of estimated deaths by country.
- The Supply Chain Dashboard: The supply chain dashboard compiles country data to show the availability and status of delivery of key malaria commodities (such as rapid diagnostic tests, malaria drugs including ACTs, and LLINs) in endemic countries and highlight potential stockouts or delayed deliveries. Support is provided to try to address stockouts including through support to source commodities and accelerate deliveries.
- The Technical Assistance Dashboard: The Dashboard tracks Technical Assistance implementation and requests made by countries through the Country Regional Support Partner Committee (CRSPC). Technical assistance may include country resource mobilization and advocacy, implementation support (including support for LLINs distribution campaigns, implementation bottleneck resolution and support for establishing effective surveillance systems), programme reviews and national strategic plans.
Impact
How the Global Malaria Dashboard enabled to ensure the global malaria response was on track during COVID-19
As the COVID-19 pandemic impacted the world, WHO modelling showed that there could be a doubling of malaria deaths in Africa, representing a reversal in the substantial progress in malaria mortality reductions seen over the last 2 decades. 2020 had been scheduled to be a major year for the global malaria response, with over 30 LLIN campaigns scheduled, and for more children than ever before projected to receive Seasonal Malaria Chemoprevention. With severe disruptions due to COVID-19, there was a risk that all campaigns could be cancelled or severely disrupted. In addition, lockdowns in supplier countries, changing priorities of manufacturers, and disruptions to the global supply chain increased the risk of shortages of ACTs, RDTs, PPE, and other essential commodities, with many countries reporting stockouts.
Through the CRSPC tracking and the Global Malaria Dashboard, the RBM Partnership was able to compile data from countries and partners to track campaign status, stock outs, technical assistance and other bottlenecks, with the outputs shared regularly through the RBM partnership website. As a result, 95% LLIN campaigns were rolled out (over 160 million LLINs were delivered by the end of 2020) and other campaigns (IRS, SMC) were also completed, with over 30 million children in areas of high seasonal transmission reached with antimalarial medicines. The enhanced data coordination also enabled major stockouts of commodities (ACTs and RDTs) to be averted due to quick responses and coordination. This included some innovative solutions such as airlifting commodities, fast-tracking and splitting orders; and borrowing commodities from neighbouring countries.
Key success factors
- Real time data to inform and drive action
- Dashboard can also be used as an advocacy tool at country level
- Visibility of bottlenecks (such as stockouts of commodities, delayed campaign) across countries can help coordinate action and support from partners